
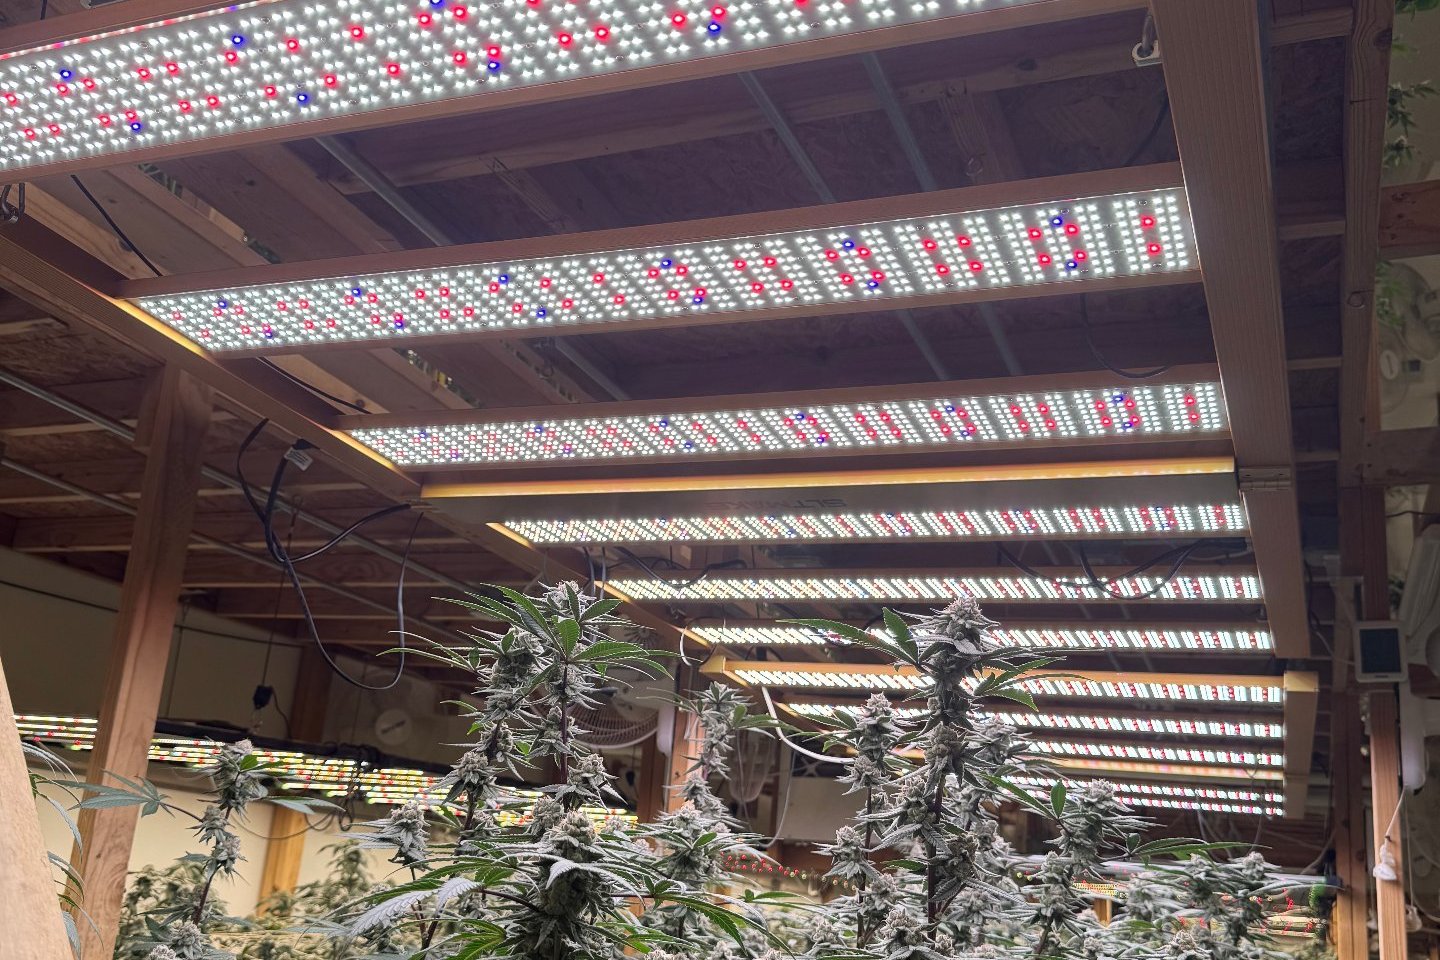
The 60-Second Answer
Plants do not photosynthesise in moles per day; they photosynthesise in photons per second, and they keep score by the day. The number that connects the two is the daily light integral: the sum of photosynthetically active photons (400–700 nm) landing on one square metre across a photoperiod, written mol/m²/day. Every lighting decision that matters commercially, fixture count, dimming schedule and electricity budget, starts from it.
| Crop group | Target DLI (mol/m²/day) | Typical photoperiod | Canopy PPFD that delivers it |
|---|---|---|---|
| Microgreens | 6–12 | 18 h | 93–185 µmol/m²/s |
| Ornamentals (bedding, pot) | 9–13 | 14–16 h | 156–258 µmol/m²/s |
| Lettuce & leafy greens | 12–17 | 16–18 h | 185–295 µmol/m²/s |
| Culinary herbs | 12–18 | 16–18 h | 185–313 µmol/m²/s |
| Strawberries | 15–20 | 16 h | 260–347 µmol/m²/s |
| Peppers & cucumbers | 20–30 | 16–18 h | 309–521 µmol/m²/s |
| Tomatoes | 20–35 | 16–18 h | 309–608 µmol/m²/s |
| Cannabis (veg 18 h) | 26–39 | 18 h | 400–600 µmol/m²/s |
| Cannabis (flower, 12 h) | 30–45+ | 12 h | 700–1050 µmol/m²/s |
Ranges recur across university extension guidance and CEA planning guides; the cannabis rows follow the stage table in our PPFD & DLI cannabis guide, which carries the full stage-by-stage numbers and the CO₂-enriched ceiling. The PPFD column converts each DLI band at the photoperiod shown, so you can read the same budget as a rate.
What Daily Light Integral Actually Measures
DLI is an integral in the calculus sense: it is the area under the curve you get when you plot PPFD against time for a full day. A room that holds 400 µmol/m²/s for 16 hours and a greenhouse that swings from 50 at dawn to 1100 at solar noon can deliver the same daily ration, because the integral adds up every photon, at whatever rate it arrived. The unit is moles per square metre per day, and one mole is 6.02 × 10²³ photons.
The three numbers are easy to confuse because they share units, so it pays to keep the ladder straight:
| Metric | Unit | What it counts | Whose property it is |
|---|---|---|---|
| PPF | µmol/s | Photons the fixture emits each second | The fixture |
| PPFD | µmol/m²/s | Photons landing on one square metre each second | The fixture and the room geometry, at one point in time |
| DLI | mol/m²/day | Photons landing on one square metre over the whole day | The room, the schedule and the sun, summed |
The full units field guide, PPF versus PPFD versus photon efficacy and the legacy terms that still appear on spec sheets, lives in our grow light terms glossary.
The Conversion Math, Done Right
Two formulas cover every DLI calculation you will run. Forward, from a setpoint to a daily ration: DLI = PPFD × hours × 0.0036. The 0.0036 converts µmol to mol and seconds to hours in one step. Backward, from a crop target to a setpoint: PPFD = target DLI × 277.8 ÷ hours. The 277.8 is just 1,000,000 ÷ 3,600, the micromole-to-mole and hour-to-second conversions folded into one constant that extension guides have used for years.
Worked examples, one in each direction. A veg room holding 550 µmol/m²/s on an 18-hour photoperiod delivers 550 × 18 × 0.0036 = 35.6 mol/m²/day. A 25 mol/m²/day herb target on a 12-hour clock needs 25 × 277.8 ÷ 12 = 579 µmol/m²/s at the canopy, the same target on an 18-hour clock needs only 386.
The reverse matrix saves the arithmetic. Find your crop target in the left column, your photoperiod across the top:
| Target DLI (mol/m²/day) | 12 h | 16 h | 18 h | 20 h |
|---|---|---|---|---|
| 10 | 232 | 174 | 154 | 139 |
| 15 | 347 | 260 | 232 | 208 |
| 20 | 463 | 347 | 309 | 278 |
| 25 | 579 | 434 | 386 | 347 |
| 30 | 695 | 521 | 463 | 417 |
| 35 | 810 | 608 | 540 | 486 |
| 40 | 926 | 695 | 617 | 556 |
All values in µmol/m²/s at the canopy. Read across a row to see what the photoperiod is worth: the same 40 mol budget costs 926 µmol/m²/s on a 12-hour clock but 617 on 18 hours, a third less intensity for the same daily dose.
What One More Percent of Light Buys You
Growers repeat the rule that one percent more light means one percent more yield. The underlying research, Marcelis and colleagues quantifying the response across roughly a hundred papers and commercial grower data, puts the honest figure lower: for most greenhouse crops a 1% increase in light raises harvestable product by 0.5–1%, and the effect is larger at lower light levels, under higher CO₂ and in winter than in summer.
| Crop group | Yield change per 1% more light | Examples in the study |
|---|---|---|
| Soil-grown vegetables | 0.8–1.0% | Lettuce, radish |
| Fruit vegetables | 0.7–1.0% | Cucumber, tomato, sweet pepper |
| Cut flowers | 0.6–1.0% | Rose, chrysanthemum |
| Bulb flowers | 0.25–1.25% | Freesia, lily |
| Flowering pot plants | 0.5–1.0% | Poinsettia, kalanchoe |
| Non-flowering pot plants | ≈0.65% | Ficus, dracaena |
Source: Marcelis, Broekhuijsen, Meinen, Nijs & Raaphorst, Acta Horticulturae 711 (2006), DOI 10.17660/actahortic.2006.711.9. The same study found the relative response grows at lower light, higher CO₂ and higher temperature, which is why lighting pays best in winter.
The practical reading: light is the most predictable yield lever a grower has, but the last percent is bought with electricity, so the question is where the response stops paying for itself. Crops differ in where that sits. Michigan State University’s flowering trials on bedding plants found the DLI that saturates flowering speed for most species between 8 and 15 mol/m²/day, with high-light species saturating at the top of that band and low-light species at the bottom. Above saturation you are buying quality and speed, not faster development, and past the crop’s stress threshold you are buying damage.
What does a delivered mole cost? At a fixture efficacy of 2.8 µmol/J, one mole of photons takes about 0.099 kWh; at 3.5 µmol/J it takes 0.079 kWh. At $0.25 per kWh that is 2.5¢ against 2.0¢ per mole, and across a 40 mol/m²/day flowering budget it is the difference between roughly $0.99 and $0.79 per square metre per day, about $59 versus $48 across a 60-day flower run. The fixture-level arithmetic, and why efficacy is the number that decides it, is in our µmol/J guide.
DLI Targets by Crop
Target bands recur across university extension guidance and controlled-environment planning literature. Treat them as bands, not setpoints: the right end of a band moves up with CO₂ enrichment and cultivar, and down with market quality requirements and electricity price.
| Crop | Target DLI (mol/m²/day) | Watch-outs |
|---|---|---|
| Microgreens | 6–12 | Fast turnover crop; modest dose is enough |
| Lettuce & leafy greens | 12–17 | Above about 17 once the canopy closes, tipburn risk rises; seedlings tolerate 20–30; staying within ±3 of target is acceptable if the surplus or deficit is made up over the next two days |
| Culinary herbs | 12–18 | Species vary; basil sits at the high end |
| Ornamentals (bedding, pot) | 9–13 | Managed to at least 10–12; flowering speed saturates between 8 and 15 for most species; below about 10, supplemental light lifts quality for nearly all crops |
| Strawberries | 15–20 | Fruit quality responds up to the top of the band |
| Peppers & cucumbers | 20–30 | Load into fruit; watch VPD as DLI climbs |
| Tomatoes | 20–35 | Year-round production target at the high end with CO₂ |
| Cannabis | 30–40+ | Stage-by-stage table, the 12/12 flip and the CO₂-enriched ceiling are in the cannabis PPFD & DLI guide |
What the Sun Delivers Where You Grow
Supplemental lighting is sized against what the sun already provides, and that number is seasonal. Weather services publish outdoor solar exposure as megajoules per square metre per day; converting to a DLI uses a factor of about 2.08 mol per MJ (Ting & Giacomelli, 1987, assuming roughly 45% of shortwave energy falls in the PAR band). Below are long-run monthly means for the capitals that matter to our markets, converted at that factor.
| City | Jan (mid-summer) | Jun (mid-winter) | Annual mean |
|---|---|---|---|
| Sydney | 47 | 18 | 34 |
| Melbourne | 51 | 13 | 31 |
| Brisbane | 49 | 25 | 38 |
| Buenos Aires | 54 | 17 | 36 |
| Mendoza | 59 | 22 | 42 |
Outdoor mean daily global solar exposure converted at 2.08 mol/MJ and rounded to whole moles. Australian values: Bureau of Meteorology satellite-derived records (Sydney Botanic Gardens 66006, Melbourne Regional Office 086071, Brisbane 040913); Australian capitals: 22.5 / 24.3 / 23.5 MJ in January and 8.7 / 6.4 / 11.9 MJ in June respectively, annual 16.3 / 15.0 / 18.5. Argentine values: NASA POWER 25-year climatology (2001–2025) for Buenos Aires (25.97 MJ Jan, 8.12 Jun, 17.25 annual) and Mendoza (28.15 / 10.80 / 20.08).
Read the June column as your lighting budget. Melbourne is the hard case: a June mean of 13 mol outdoors is barely a leafy-green dose before any greenhouse losses, and the Bureau’s records show a dull June averaging as little as 11. Mendoza sits in another climate altogether: its Andean winter sun leaves 22 mol outdoors in June, about what Melbourne gets in April. Buenos Aires runs between the two. Brisbane, subtropical, barely has a winter light problem at 25.
Sizing Supplemental Lighting From the Deficit
The sizing chain is one subtraction and one conversion: target DLI, minus the natural DLI that reaches the crop, equals the deficit; the deficit spread across your photoperiod converts to an average PPFD. Two worked examples, one per market:
Melbourne lettuce greenhouse, June. Outdoor mean 13.3 mol; at 55% transmission the crop sees 7.3. A 15 mol target leaves a deficit of 7.7 mol. Spread over a 16-hour photoperiod: 7.7 × 1,000,000 ÷ (16 × 3,600) = 134 µmol/m²/s of supplemental light. That sits comfortably inside the 50–200 µmol/m²/s range that commercial greenhouse supplemental systems typically deliver at crop level.
Mendoza cannabis flower greenhouse, June. Outdoor mean 22.5 mol; at 55% transmission, 12.4. A 35 mol flower target leaves a deficit of 22.6 mol. On a 12/12 clock the hours are fixed, so the whole deficit must arrive as intensity: 22.6 × 1,000,000 ÷ (12 × 3,600) = 523 µmol/m²/s. This is the photoperiod constraint biting: when the clock cannot stretch, only the dimmer can close the gap, which is exactly the situation in the flip-week section of our cannabis guide.
Three operational notes before the numbers go into a purchase order. First, run the lamps against the sun, not a timer: Runkle’s standing advice is to control supplemental lighting from an environmental control system or quantum sensor and to switch off once the day’s accumulated DLI reaches the target, because lamps running on a bright afternoon are pure waste. Second, count fixtures from the PPFD and the bed area, not from the mole budget: the fixture-count guide walks that geometry, and it is the bed layout that decides the count. Third, schedule hours around the tariff: pushing runtime into off-peak windows changes the electricity bill for the same photons, and the demand charges guide covers how runtime shape shows up on a commercial bill.
How to Measure DLI So the Numbers Mean Something
A DLI figure is only as good as the measurement behind it, and most bad figures come from measuring a rate and calling it a dose. The instrument is a quantum sensor: it counts photons between 400 and 700 nm, the band plants photosynthesise in. It needs to sit level (the cosine correction assumes it), at canopy height, away from shadows and reflective walls.
The right measurement is an integral, not a reading. A logging quantum sensor left in the crop for 24 hours reports DLI directly, and after a few overcast and clear days you have the seasonal number that sizing needs. A handheld survey, one afternoon, one spot, tells you the rate at that moment and nothing about the day.
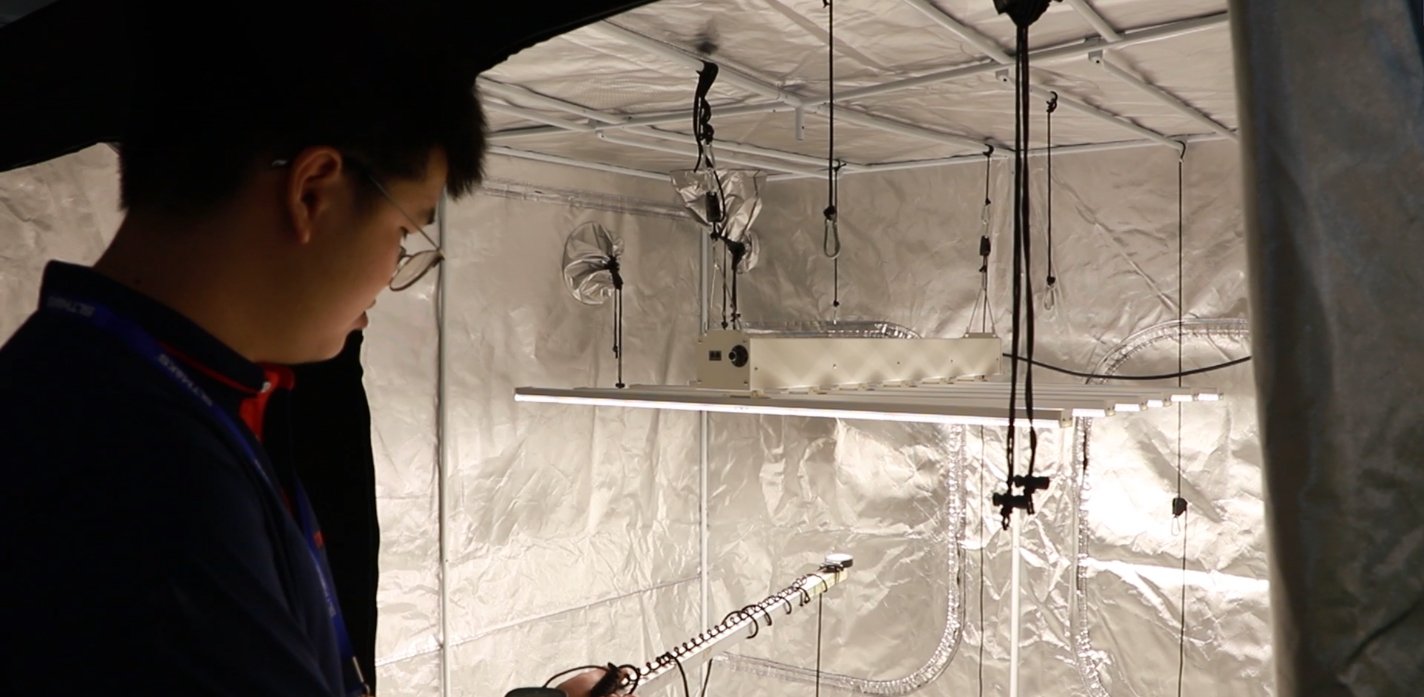
If you are working with a handheld meter and a notebook, the manual method is the same integral by hand: take a reading every 30 minutes from sunrise to sunset, multiply each reading by the 1,800 seconds between readings, add the products up and divide by 1,000,000 to convert to moles. It is tedious and it only captures one day, but done on a typical overcast day and again on a clear one it brackets the range your room actually lives in. Sample several positions and average them; a single spot over an aisle or under a fixture overstates the room, and how far the spots disagree is the uniformity question covered in the PPFD map guide.
Why a lux meter will not get you there: lux is weighted to human vision, and the conversion from lux to photon flux depends on the spectrum of the source. The classic extension conversion table makes the point: one megajoule of sunlight reads as 32.4 klux-hours but delivers 2.08 mol, while the same megajoule from high-pressure sodium reads as 53.1 klux-hours and delivers 2.25 mol. The reading moved by 64% while the photons barely moved, and a red-heavy LED spectrum moves it further still. Unless you know the exact spectrum, converting lux to DLI is guesswork. Phone apps inherit the same problem plus an uncalibrated camera; use them for sanity checks, never for sizing.
Finally, maintain the sensor. Dust and glare scatters cost a few percent each, and a sensor that has drifted 10% quietly shifts every DLI figure you quote. Re-check annually against a reference meter, and log the reading alongside the date so drift shows up in your records rather than in your yield.
Controlling DLI Instead of Chasing It
There are two ways to run a lighting schedule. The old way is a timer: fixtures on at 06:00, off at 22:00, every day, all year. The problem is that the crop’s need does not move but the sun’s does, so a timer pays for photons the sun already delivered on clear days and falls short on the dark ones. The modern way closes the loop on the integral itself:
- Sensor-driven on/off. A quantum sensor on the controller tracks the day’s accumulated DLI; supplemental lamps run only while the day is short of target and stop the moment it is met. Runkle’s guidance is blunt on this point: control lamps with an environmental control system or quantum sensor, not a timer, and turn the system off when the average DLI exceeds the target.
- Dim-to-target. With dimmable fixtures the controller does not just switch, it trims: output rises through the dark months and backs off as the sun covers more of the ration. LEDs make this practical because they cycle and dim instantly, with none of the deadband discipline HPS lamps need to protect bulb life.
- Delivery shape. The same daily ration can arrive as 16 gentle hours or 12 intense ones, and the controller is what lets you move between them season by season, or hour by hour to keep load out of tariff peaks. Sunrise and sunset ramps on the channels also spare the crop a hard step at lights-on.
One room, one dimming curve, twelve different natural-light months: in Melbourne the fixtures carry January by idling and June by working flat out. That is the practical case for dimmable, sensor-integrated fixtures over fixed-output lamps, and our controller page shows the hardware that runs it.
Where DLI Stops Being the Whole Story
DLI is the quantity axis, and quantity does most of the work in commercial production. But four things sit between a mole of photons and a gram of harvest, and each one moves the number you should target:
- Spectrum. As daily dose rises, spectrum matters less for growth: in Runkle’s summary of the research, once the DLI exceeds roughly 12–15 mol/m²/day, red light alone performs about as well as red plus far-red for long-day plants. At low DLIs, spectrum choices carry more weight. Where spectrum does its real work is morphology and quality, which is the territory of the spectrum guide.
- CO₂. Enrichment raises the ceiling on useful intensity, which is why CO₂-fed rooms run higher PPFD bands and higher DLI budgets than ambient rooms; the numbers are in the cannabis guide and they are large.
- Climate and roots. MSU’s supplemental lighting guidance makes the point that if CO₂, water or fertility are limited, the benefit of extra light shrinks with them. A higher DLI also drives transpiration, so VPD, irrigation and HVAC have to keep up or the extra photons are vented as heat.
- Where the photons land. DLI is defined on a plane at the top of the canopy, and a top-plane number cannot see inside the crop. Under-canopy lighting adds photons to the lower leaf and bud zone that the top-of-canopy integral never counts; that is a different measurement plane, not a bigger number on the same one, and our under-canopy range covers what it changes.
And one warning that applies to every average in this guide: an average hides a floor. A canopy that averages 40 mol/m²/day with one corner at 22 is a 22-mol room for the plants standing in that corner, and they will grow like it. Uniformity is a measurement and layout discipline, and the PPFD map section of our cannabis guide covers the thresholds we build to.
Common Mistakes We See
- Quoting the fixture’s PPF as a PPFD or DLI. PPF is what the fixture emits; what the canopy receives depends on mounting height, footprint and overlap. A µmol/s figure on a spec sheet is not a dose.
- Calling one spot reading the room’s DLI. A point under a fixture can read 30% above the canopy average. DLI claims should come from averaged, multi-point, full-day data.
- Converting lux with a daylight factor on an LED room. The lux-to-photon factor is spectrum-specific; on a red-heavy LED the daylight shortcut can be off by half. Measure photons with a quantum sensor.
- Sizing to the summer sun. A greenhouse that is adequate in January is short in June in every one of the five cities in the table above. Size to the winter deficit, then control the surplus.
- Forgetting the transmission factor. Outdoor weather data is not crop-level data. Applying 50–60% (or a measured figure for your house) is the difference between a real deficit and a comfortable-looking one.
- Stretching the photoperiod on a short-day crop. Cannabis flowering needs its uninterrupted dark period; on a 12/12 clock, intensity is the only lever, and the budget math has to respect that.
FAQ
What is a good DLI for plants?
Most greenhouse crops do well between 9 and 35 mol/m²/day: ornamentals at 9–13, leafy greens at 12–17, fruiting crops such as tomatoes at 20–35, and high-light crops such as cannabis above 30. Ornamental crops are commonly managed to at least 10–12 mol/m²/day.
What is the difference between PPFD and DLI?
PPFD is the instantaneous rate in µmol/m²/s, like a speed. DLI is the accumulated daily dose in mol/m²/day, like the odometer at the end of the day. The same PPFD delivers very different DLIs over 12 hours and 18 hours.
How do I calculate DLI from PPFD?
Multiply PPFD by the photoperiod in hours and by 0.0036. A canopy at 550 µmol/m²/s for 18 hours receives 550 × 18 × 0.0036 = 35.6 mol/m²/day.
How do I work out the PPFD I need for a target DLI?
Multiply the target DLI by 277.8 and divide by the photoperiod in hours. A 25 mol/m²/day target on a 12-hour clock needs 25 × 277.8 ÷ 12 = 579 µmol/m²/s at the canopy.
What DLI do tomatoes need?
Greenhouse tomatoes are planned at 20–35 mol/m²/day. Fruiting crops sit at roughly double the daily dose of leafy greens because the crop has to load carbohydrate into fruit, and yield scales with the light budget up to the crop’s saturation point.
Is more DLI always better?
No. Every crop has a saturation point past which extra photons stop converting to growth and start costing electricity, and some crops tip into stress: lettuce is limited to about 17 mol/m²/day once the canopy closes because of tipburn, and unrooted cuttings can bleach under too much light.
How many hours of light do I need to reach 20 mol/m²/day?
At 20 mol/m²/day: about 463 µmol/m²/s on a 12-hour clock, 347 on 16 hours, 309 on 18 hours and 278 on 20 hours. The shorter the photoperiod, the higher the intensity you need.
How do I measure DLI without an expensive meter?
Take a handheld quantum sensor reading every 30 minutes from sunrise to sunset, multiply each reading by 1,800 seconds, add the products and divide by 1,000,000 to get mol/m²/day. Average several spots, and do not convert from lux unless you know the light source’s spectrum.
What happens when greenhouse DLI is too low in winter?
Growth slows, crop time stretches and quality drops. Below roughly 10–12 mol/m²/day, supplemental lighting lifts quality for nearly all greenhouse crops. Size it from the deficit: target DLI minus inside natural DLI, converted to an average PPFD over your photoperiod.
Does DLI replace spectrum?
No. Light quantity does most of the work, and its effect is measurable and repeatable: a 1% increase in light raises harvestable yield by roughly 0.5–1% across greenhouse crops. Spectrum still shapes morphology and quality, but its relative weight falls as DLI rises; above roughly 12–15 mol/m²/day, red light alone matches red plus far-red for long-day plants.