
The 60-Second Answer
| Metric | Unit | What it measures | The question it answers |
|---|---|---|---|
| PPF | µmol/s | Photons the fixture emits each second across the 400–700 nm band | How much light does the fixture make? |
| PPE (µmol/J) | µmol/J | Photons per joule of electricity: PPF divided by input watts | What does that light cost to run? |
| PPFD | µmol/m²/s | Photons landing on one square metre of canopy each second | How much light reaches this spot? |
| DLI | mol/m²/day | PPFD accumulated across a full photoperiod | How much light does the canopy bank per day? |
The split that matters: PPF and PPE are properties of the fixture, measured in a laboratory before anything is hung. PPFD and DLI are outcomes in your room, set by the fixture plus mounting height, optics, spacing and photoperiod. The most common spec-sheet error in commercial purchasing is comparing a fixture number against a room number, and the most expensive one is buying PPE as if it were a yield number. We cover the room side in detail in PPFD & DLI: Target Numbers by Stage; this page stays with the hardware.
PPF, PPE and PPFD: Three Numbers, Three Jobs
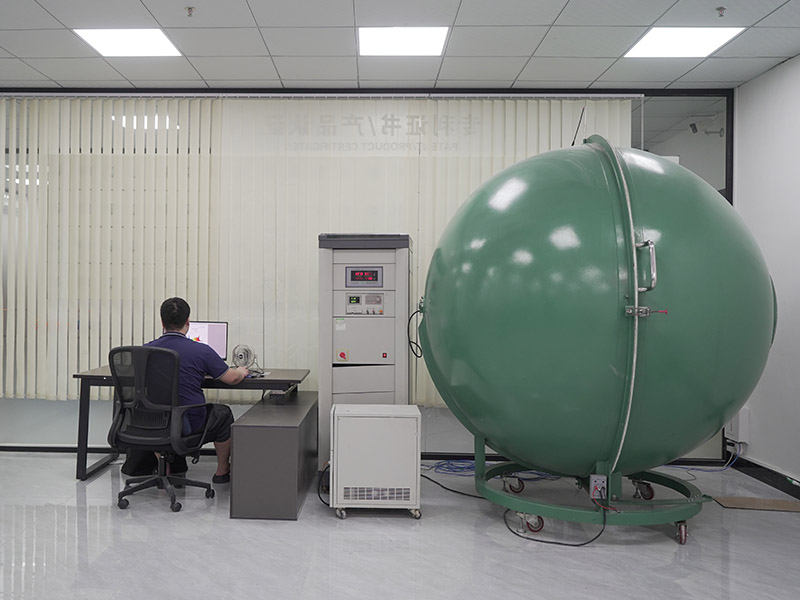
PPF (photosynthetic photon flux) counts the photons a fixture emits every second across the photosynthetically active band, in micromoles per second. It is measured with the assembled fixture in an integrating sphere, and it carries no information about direction: the DLC describes PPF as an integrated value for the entire fixture that contains no spectral or directional information. Where those photons land is a separate report, which is why a map exists at all.
PPE (photosynthetic photon efficacy), written µmol/J, is PPF divided by the watts the fixture draws from the wall. It is the miles-per-gallon figure of horticultural lighting: it says nothing about how much light you get, only what each unit of light costs in electricity. Because a watt is a joule per second, the ratio simplifies to micromoles per joule, and PPE and µmol/J are the same statement in two notations.
PPFD (photosynthetic photon flux density) is what a quantum sensor reads at the canopy, in µmol/m²/s. It depends on the fixture's PPF, then on everything the buyer controls: mounting height, optics, bar spacing and the overlap between fixtures. Two fixtures with identical PPF can produce completely different PPFD maps, which is why the map, not the brochure, is what a layout is bought on.
One unit to refuse outright: lumens and lux. Both are weighted for the human eye, which peaks in yellow-green around 555 nm. That weighting over-represents the green light plants use moderately and under-represents the deep red they use heavily, so a lux meter systematically misreads a horticultural fixture. Anyone quoting lumens or lux for a grow light is measuring human vision and selling it as plant light.
One consequence is worth stating outright, because vendors blur it: there is no conversion factor between lm/W and µmol/J. The ratio between the two depends entirely on the spectrum, so a red-heavy fixture and a white fixture with identical lm/W can sit at very different efficacies. Any claim that a certain lm/W "equals" a certain µmol/J is not a conversion, it is an estimate dressed as arithmetic. Compare fixtures in µmol/J and PPFD, never in lumens.
The Only Two Formulas You Need
Everything else on this page follows from two lines of arithmetic, and both are worth doing once by hand so a supplier's numbers can be checked mentally ever after.
Worked on our own flagship: the Advanced Golden 1300W ships 3900–4550 µmol/s at 1300 W, which is 3.0–3.5 µmol/J. The published range and the published PPF agree, which is exactly what a self-consistent spec sheet looks like.
A kilowatt-hour is 3.6 megajoules, so a fixture at 2.8 µmol/J delivers 10.08 mol of photons per kWh, and one at 3.3 delivers 11.88. This single multiplication converts any efficacy claim into a number your utility meter can check.
What µmol/J Does to Your Power Bill
Divide 1,000 mol of photons by the photons-per-kWh figure and you get the electricity each unit of light actually consumes. At a commercial tariff of $0.10/kWh:
| Fixture PPE | Photons per kWh (mol) | kWh per 1,000 mol | Cost per 1,000 mol at $0.10/kWh |
|---|---|---|---|
| 2.0 µmol/J | 7.2 | 139 | $13.89 |
| 2.5 µmol/J | 9.0 | 111 | $11.11 |
| 2.8 µmol/J | 10.1 | 99 | $9.92 |
| 3.0 µmol/J | 10.8 | 93 | $9.26 |
| 3.3 µmol/J | 11.9 | 84 | $8.42 |
| 3.5 µmol/J | 12.6 | 79 | $7.94 |
Scale the last column to your own tariff; the ratio holds. A workable rule of thumb across the 2.5–3.5 band: every 0.1 µmol/J is worth roughly 3–4% of the electricity bill for the same photon output.
The same gap shows up a second time as heat. Hold the photon output and the spectrum constant and the lower-efficacy fixture draws more watts; the light it emits is unchanged, so the surplus input power leaves the room as heat the HVAC system has to move. A low µmol/J specification is paid for on the meter, and in a cooling-dominated room it is paid for a second time in the cooling load that removes it.
Worked across a room, the difference stops being abstract. Take a 1,000 W-class fixture running 12 hours a day for a 365-day flower schedule: 4,380 kWh per fixture per year. A fixture at 3.3 µmol/J banks 52,034 mol of photons in that year; a fixture at 2.8 µmol/J needs 5,162 kWh to deliver the same photon count, which at $0.10/kWh is $516 against $438. Matched for light, the efficacy gap costs $78 per fixture per year:
| Tariff | Extra electricity per fixture, per year | Per 1,000-fixture room |
|---|---|---|
| $0.10/kWh | $78 | $78,200 |
| $0.15/kWh | $117 | $117,300 |
| $0.25/kWh | $196 | $195,500 |
What Good Efficacy Looks Like in 2026
The reference points moved fast, and the history explains why quotes written in different years disagree. Until 2014, the best horticultural LED fixtures were no more efficient than the best conventional option, the double-ended HPS with an electronic ballast: both sat near 1.7 µmol/J. The DLC's first horticultural threshold in 2018 was 1.9 µmol/J. The V3.0 requirements raised it to 2.30, and the current V4.0 requirements set it at 2.5 µmol/J, an 8.7% step that delists roughly the least efficient 11% of the previous list. Every figure is measured at the fixture level on the 400–700 nm band under ANSI/IES LM-79.
Two statistics put the top of the market in perspective. Entering 2022 the DLC's horticultural qualified products list carried over 600 fixtures with measured efficacies from 1.81 to 3.69 µmol/J; more than half cleared 2.5, and only about 6% reached 3.0. And the average efficacy of listed products has risen 24.9% since the first version of the program. A fixture at 3.0 or better is therefore genuinely premium hardware, not a marketing baseline.
| Fixture PPE | Where it sits in 2026 |
|---|---|
| Below 2.3 µmol/J | Below the previous DLC floor. Dated hardware for a new commercial install. |
| 2.3–2.5 µmol/J | Met the V3.0 floor; below the current V4.0 floor of 2.5. |
| 2.5–2.8 µmol/J | At the current DLC floor. Entry commercial; viable where capital budget dominates and runtime is short. |
| 2.8–3.1 µmol/J | Mainstream commercial. Where most serious quotes land, and where our core series sits. |
| 3.0–3.5 µmol/J | Top tier. Roughly the best 6% of listed fixtures as of 2022. |
| Above 3.5 µmol/J | Deserves scrutiny. The published fixture-level ceiling on current LED technology is 3.4 µmol/J for white-plus-red spectra; higher numbers are physically possible for blue-plus-red spectra but should arrive with test conditions attached. |
For reference, the fixture this industry replaces is the 1000 W double-ended HPS at roughly 1.7 µmol/J; the DLC describes its own 2.5 floor as more than 45% above that benchmark. Every row of the table above clears it, which is why the useful comparison is never LED against HPS any more, it is fixture against fixture. The retrofit economics get their own guide in the Compare & Choose section.
The Physical Ceiling: How High Can µmol/J Go
Efficacy is not a soft target that better engineering keeps pushing. Photons cost energy, short wavelengths cost more than long ones, and the conversion chain from wall power to canopy photons loses a fixed share at every stage. The peer-reviewed ceiling matters commercially because it tells you when a quoted number has left the range physics supports.
The research anchor
Kusuma, Pattison & Bugbee (Utah State University, 2020) worked the chain end to end. At the LED package level, blue emitters reach up to 93% conversion efficiency, phosphor-converted whites 76%, and reds 81%. A fixture then subtracts four losses the bare package never sees: current droop as drive current rises, thermal droop as junctions heat, driver losses in the AC-to-DC supply, and optical losses in lenses and covers. With current LED technology their calculation puts the fixture-level limit at 3.4 µmol/J for white-plus-red fixtures and 4.1 µmol/J for blue-plus-red and sealing a fixture against water and humidity costs roughly a further 10%. The paper is a perspective, not a product claim, which is exactly why it is useful: it bounds what any vendor can honestly promise.
Source: Kusuma, Pattison & Bugbee, Horticulture Research 2020, 7:56, doi 10.1038/s41438-020-0283-7.
The Same Fixture, Five Honest Numbers
Because µmol/J travels without its measurement basis, two vendors can quote one physical fixture and both be describing a version of the truth. The table below takes a single hypothetical fixture and reports it five ways. Every row is a number a real supplier has used, and only the last two describe the lamp that would arrive on a pallet.
| Measurement basis | Reported PPE | What it leaves out |
|---|---|---|
| Diode level, ideal 25 °C, 100 mA/mm² | 3.5 µmol/J | Driver, thermal and optical losses: a package number, not a lamp. |
| Best-unit peak bin | 3.2 µmol/J | The single best unit tested, not the average of the production run. |
| LED power only, driver and fan excluded | 3.1 µmol/J | Understates the true wall draw, which is the denominator that matters. |
| Fixture level, 277 V wall draw, thermal equilibrium | 2.75 µmol/J | Nothing. This is a number to compare. |
| Fixture level, 120 V wall draw, full spectrum | 2.80 µmol/J | Nothing. This is a number to compare. |
One physical product spans 2.75 to 3.5 µmol/J depending on which row a vendor chose. Ask for all five, and the empty rows tell you which claim to discount.
The ceiling also explains a spectrum trade every buyer should recognise. Red emitters yield roughly 30% more photons per joule than blue, and blue roughly 20–25% more than white, not because red converts electricity better (blue wins that comparison outright, 93% against 81%) but because a red photon carries less energy, so the same joule buys more of them. A spectrum loaded with red therefore measures higher in µmol/J than the same fixture built with a white component, at identical wattage. Whites cost some measured efficacy and buy back two things the metric cannot see: a workable light for inspection, pest scouting and judging plant colour, and green photons that penetrate deeper into the canopy to reach the lower leaves red and blue light largely misses. The right question is not which spectrum measures best, it is which one the crop and the people working under it need, with the efficacy number read in that context.
Where the Number Stops Being the Answer
Four realities sit between a laboratory efficacy figure and a productive room, and none of them appear in the µmol/J value.
- Distribution. PPE says nothing about where the photons land. A fixture can convert electricity efficiently and still pour light into aisles and walls while the corners of the canopy run short. The map, not the efficiency figure, decides that; the 9-point grid and the minimum-to-average thresholds in our PPFD guide are the working test.
- Spectrum, and what the metric deliberately excludes. PPE counts photons from 400 to 700 nm by definition, and the DLC confirmed in 2021 that it would keep that boundary rather than extend it to 750 nm. The excluded far-red band is not horticulturally dead: peer-reviewed work at Utah State showed far-red photons added at up to about a third of the photon flux raised canopy photosynthesis as much as an equal number of 400–700 nm photons, though far-red alone did almost nothing. A fixture that spends watts on far-red, UV or IR channels will therefore measure a lower µmol/J while doing work the metric cannot credit. Channels that switch off matter here: they let a room run the base spectrum when the extra bands are not wanted, and they let the base efficacy be measured honestly.
- Degradation. LEDs emit fewer photons as they age, and heat accelerates the decline. Three letters carry the claim: L90 is the hours a fixture runs before output falls to 90% of its initial value, L70 is the same test at 70%, and Q90 is the share of units still above 90% at rated life. The DLC requires a photon flux maintenance claim of Q90 at 36,000 hours or better on the 400–700 nm band, plus a driver lifetime of at least 50,000 hours. A fixture with no maintenance claim is priced on year one.
- Dimming behaviour. Lower drive current raises the emitter's conversion efficiency while a tunable driver loses a little in conversion, so fixture efficacy at full output is not automatically the efficacy you run in a veg room at reduced output. Ask for the number at your setpoints, or measure a sample.
When a Higher µmol/J Is the Wrong Buy
Efficacy is a running-cost number, so the premium it carries only pays back where run hours, climate and coverage cooperate. The table names the commercial cases where paying for a higher figure quietly loses money. Each is a legitimate specification choice, not a defect in the fixture.
| Situation | Why the premium does not pay back |
|---|---|
| Short run hours, below roughly 1,500 a year | Savings accumulate too slowly to recover the upfront price difference. |
| Cold season, or a room that needs the heat | Low-efficacy waste heat is doing useful heating work; removing it can add a heating bill that cancels the electricity saving. |
| Coverage mismatch in a wide, low room | A narrow-beam efficient fixture throws photons at walls where no leaf catches them. |
| Propagation and low-light rooms | Seedlings and cuttings draw so few kilowatt-hours that the premium has almost nothing to amortise against. |
| Far-red-rich or signal-spectrum products | A lower PPE is a deliberate design trade; judging that fixture on efficacy alone misreads what it is for. |
| No flux maintenance or Q90 data | A higher new-lamp rating that decays quickly can fall behind a lower-rated fixture within a few seasons. |
The cold-room row is the one buyers miss, and it is why this page qualifies its own heat argument. In a cooling-dominated flower room, the low-efficacy fixture's surplus watts are paid for twice: once on the meter and once in the cooling load that removes them. In a heated greenhouse or a cold-season room, those same watts offset heating instead, and the case reverses. Run the arithmetic against your own climate before paying for efficiency the room cannot convert into flower; the retrofit side of that calculation is worked in HPS to LED retrofit economics.
None of this argues that the entry tier is good enough. The DLC floor of 2.5 µmol/J is where a fixture stops being disqualified, and the mainstream commercial band sits a tier above it. The point is narrower: efficacy is one input to a payback calculation, and a payback calculation needs your run hours, your climate and your coverage before the number means anything.
How to Verify a Claimed µmol/J
Every check below is something a manufacturer with an in-house lab answers in one email, and something a rebadger of other people's fixtures answers with adjectives.
- Fixture, not diode. Confirm the figure describes the assembled fixture including its driver. Diode datasheets are package-level measurements, and the four fixture losses above are exactly the distance between the two numbers.
- Wall-draw watts. PPE is PPF divided by input power, so ask which wattage the division used. A figure computed at a reduced test current will not survive contact with a room running at full output.
- The method, not the summary. Ask for the photometric report itself: LM-79 measurement on an integrating sphere or goniophotometer, with the 400–700 nm band stated.
- The channel state. For fixtures with switchable UV, IR or far-red channels, ask which state was measured. For DC-powered products, the DLC requires the threshold to be met at the AC de-rated value, which is the honest one.
- Independent confirmation. Look the model up on the DLC's published qualified products list, where the measured PPF, PPE and spectrum are filed per model number. If a fixture is not listed, ask why before accepting its numbers.
- The map against your room. Insist on a PPFD map that states mounting height, footprint and dimming level, run for your dimensions rather than a demo room. A map without stated conditions is decoration, and it is the only check that catches distribution failures the efficacy figure cannot see.
Two short worked examples show what the division catches. Both are illustrative, using fictional brands and internally consistent figures; no row describes a real product.
| Claim as printed | The division | What it reveals |
|---|---|---|
| "3.2 µmol/J, 1,536 µmol/s, 480 W LED" | 1,536 ÷ 520 W at the wall = 2.95 µmol/J | The wattage was a diode rating, not the wall draw, so the claim is optimistic by roughly 8%. |
| "3.7 µmol/J, 2,220 µmol/s, 600 W LED" | 2,220 ÷ 600 W at the wall = 3.7 µmol/J | The arithmetic holds, but the value sits above the published white-plus-red ceiling, so it is diode-level or peak-bin data wearing a fixture label. |
How We State Our Own Numbers
Transparency is the point of this page, so our own figures belong in it. Series ranges below are measured at the fixture level in the integrating sphere lab shown above, verified per production batch, with the test report shipped with the order:
| Series | Fixture PPE | Power range |
|---|---|---|
| Advanced Golden 1300W | 3.0–3.5 µmol/J | 1300 W |
| 4×4Ft High-End | 2.9–3.0 µmol/J | 600–1000 W |
| 4×6Ft | 2.8–3.0 µmol/J | 1000–1400 W |
| 4×8Ft | 2.8–3.1 µmol/J | 1200–1600 W |
| ECO Series | 2.5–2.8 µmol/J | 240–1200 W |
| Under-canopy bars | 2.8–3.0 µmol/J | 120–300 W |
Two of those ranges are worth reading against each other. The Golden 1300W build measured 3.3 µmol/J in the first room we documented end to end, which returned 230 lbs of dried, trimmed flower from 32 fixtures; the 4×6 ft 1000W build measured 2.9 in a second documented room and returned 235 lbs from 38 fixtures. The higher-efficacy room did not out-yield the lower one per fixture, which is the whole argument of this page in two data points. Both rooms, with sizes, fixture counts and harvest figures, are published in our case studies.
Common Mistakes We See
- Comparing diode datasheets as if they were fixtures. Vendor A's 3.2 µmol/J package and vendor B's 2.9 µmol/J fixture are not 0.3 apart; they are different measurements entirely.
- Comparing a fixture number against a room number. PPF and PPE belong to the hardware; PPFD and DLI belong to the room. Quotes and counter-quotes that mix them are noise.
- Buying µmol/J the room cannot use. Above the PPFD the environment can process, extra photons are vented as heat. Efficacy makes the wasted photons cheaper, not useful. Fix the room limit first.
- Reading the DLC floor as a recommendation. 2.5 µmol/J is where a fixture stops being disqualified, not where good lighting starts. The commercial mainstream sits a full tier higher.
- Paying for spectrum-blind comparisons. A red-loaded fixture measures higher for the same crop value; a far-red-equipped fixture measures lower while doing work the metric ignores. Compare fixtures with comparable spectra, and ask what the extra channels are for.
- Accepting a first-year number for a ten-year asset. No photon maintenance claim and no driver lifetime means the price is quoted on year one and the shortfall lands in years three to five.
- Forgetting the heat bill. The low-efficacy fixture's penalty is paid twice: once on the meter and once in the cooling that removes the surplus watts. Neither line item appears on the fixture quotation.
FAQ
What is a good µmol/J for a grow light?
In 2026, 2.5 µmol/J is the floor a commercial fixture should clear: it is the current DLC horticultural threshold. The mainstream commercial band is 2.8–3.1 µmol/J, and 3.0–3.5 is top tier; as of 2022 only about 6% of DLC-listed fixtures reached 3.0. Claims above 3.5 deserve scrutiny, because the published fixture-level ceiling on current LED technology is 3.4 µmol/J for white-plus-red spectra.
What is the difference between PPF and PPFD?
PPF (µmol/s) is the number of photons a fixture emits each second across the 400–700 nm band: a property of the hardware, measured in a lab. PPFD (µmol/m²/s) is the number of photons landing on one square metre of canopy each second: an outcome in your room, set by PPF plus mounting height, optics and spacing. Compare fixtures on PPF and PPE; compare rooms on PPFD maps and DLI.
Is µmol/J the same as PPE?
Yes. PPE (photosynthetic photon efficacy) is the name of the metric, and µmol/J is its unit. When a specification says PPE 2.9 or 2.9 µmol/J, it is the same claim: PPF divided by input watts.
Does a higher µmol/J fixture grow more?
Not by itself. Efficacy decides what the photons cost, not what they produce; yield follows PPFD at the canopy, DLI over the photoperiod, and the environment around the plant. Two of our own documented rooms return different pounds per light at different fixture PPE, because plant density, veg time, cultivar and CO₂ dominate. Read efficacy as a running-cost number and a heat-load number, then judge yield from room data.
Why is the diode rating higher than the fixture rating?
Diode datasheets measure the LED package alone under controlled conditions. A fixture adds four losses the package never sees: current droop as drive current rises, thermal droop as junctions heat up, driver conversion losses, and optical losses from lenses and protective covers, which cost roughly another 10% where fixtures are sealed against humidity. That is why a diode rated 3.2 µmol/J can land in a fixture measuring 2.8.
How do I verify a claimed µmol/J before I buy?
Ask for the test report, not the summary, and check five things: the number describes the assembled fixture including its driver; the wattage used is the wall draw; the method is LM-79 photometry on an integrating sphere or goniophotometer; the channel state is stated for fixtures with switchable UV, IR or far-red channels; and the model appears on the DLC qualified product list. Then ask for a PPFD map of your own room dimensions.
Does µmol/J change when you dim?
It can move either way. Lower drive current raises the diode-level conversion efficiency, so the emitters gain a little, while a tunable driver loses a little in conversion. The net result depends on the driver design, so ask the manufacturer for fixture efficacy at your dimming setpoints, or measure a sample before the room is built.
Does efficacy drop over the fixture's life?
Yes, LEDs emit fewer photons as they age, and heat accelerates the decline. The claim to ask for is a photon flux maintenance figure: L90 and L70 give the hours before output falls to 90% or 70% of its initial value, and Q90 gives the share of units still above 90% at rated life. The DLC requires Q90 at 36,000 hours or better on the 400–700 nm band, plus a driver lifetime of at least 50,000 hours. Ask for the maintenance figure and the conditions behind it; a fixture without one is priced on its first year, not its service life.