
The 60-Second Answer
| Growth stage | Target PPFD (µmol/m²/s) | Typical photoperiod | Resulting DLI (mol/m²/day) |
|---|---|---|---|
| Fresh cuttings / clones | 100–200 | 18 h | 6.5–13 |
| Seedlings | 200–300 | 18–24 h | 13–26 |
| Veg | 400–600 | 18 h | 26–39 |
| Mother plants / late veg | 550–700 | 18 h | 36–45 |
| Early flower (weeks 1–3) | 700–900 | 12 h | 30–39 |
| Peak flower (weeks 4–7), ambient CO₂ | 900–1200 | 12 h | 39–52 |
| Peak flower, CO₂ enriched (>900 ppm) | up to 1500 | 12 h | up to 65 |
Every number in this table is a canopy-level average, measured at the top of the flowering canopy, not the fixture rating. Read the two flower rows against the DLI budget that drives crop planning: on a 12-hour clock a 30–45 mol/m²/day ambient budget lands at roughly 700–1050 µmol/m²/s, so the 1050–1200 stretch of the peak-flower band is where an ambient room has to be at the top of its game, or running CO₂, to convert those photons rather than vent them as heat. The rest of this guide shows where those numbers come from, how to turn them into a fixture count, and where rooms commonly get it wrong.
PPFD and DLI, Defined in Plain Terms
PPFD (photosynthetic photon flux density) is the number of usable light photons landing on one square meter every second, measured in µmol/m²/s. Think of it as the intensity your canopy experiences at this instant. It is the number a handheld quantum sensor displays, and the number every serious PPFD map plots.
DLI (daily light integral) is the total photons delivered per square meter over a whole day, measured in mol/m²/day. Think of it as the daily ration. The same intensity feels very different over 12 hours versus 18 hours, and DLI is how you account for that.
Plants respond to both. Intensity drives the rate of photosynthesis in the moment; the daily integral drives how much total carbohydrate the plant can bank over a photoperiod. Fixture layouts are designed against PPFD, but crop planning is budgeted in DLI, and the two are connected by one formula:
Example: 1000 µmol/m²/s across a 12-hour flower day = 1000 × 12 × 0.0036 = 43.2 mol/m²/day. The same 1000 on an 18-hour veg schedule = 64.8 mol/m²/day, which is why veg rooms dim the same fixtures rather than buying different ones.
PPFD to DLI: The Conversion Table
Two formulas cover every calculation in this guide. Forward, to find the DLI a setpoint delivers: DLI = PPFD × hours × 0.0036. Backward, to find the PPFD a DLI target requires: PPFD = target DLI × 277.8 ÷ hours. Worked example of the second: a 40 mol/m²/day flower target on a 12-hour clock needs 40 × 277.8 ÷ 12 = 926 µmol/m²/s at the canopy.
The matrix below saves the arithmetic. Find your setpoint on the left, your photoperiod across the top:
| Canopy PPFD (µmol/m²/s) | 12 h | 16 h | 18 h | 20 h | 24 h |
|---|---|---|---|---|---|
| 400 | 17.3 | 23.0 | 25.9 | 28.8 | 34.6 |
| 600 | 25.9 | 34.6 | 38.9 | 43.2 | 51.8 |
| 800 | 34.6 | 46.1 | 51.8 | 57.6 | 69.1 |
| 1000 | 43.2 | 57.6 | 64.8 | 72.0 | 86.4 |
| 1200 | 51.8 | 69.1 | 77.8 | 86.4 | 103.7 |
| 1500 | 64.8 | 86.4 | 97.2 | 108.0 | 129.6 |
All values in mol/m²/day. Two cells are worth memorising: 1000 µmol/m²/s on 12 hours is 43.2, and the same 1000 on 18 hours is 64.8. One fixture, half again as much daily ration, which is exactly why veg rooms dim instead of re-gearing.
PPFD Targets by Stage: Where the Numbers Come From
The stage table above reflects the convergence of three sources: peer-reviewed photosynthesis curves for cannabis, controlled production trials, and the operating practices of licensed facilities. The important reference points:
The research anchors
Chandra and colleagues (University of Mississippi) mapped leaf-level gas exchange across PPFD levels from 0 to 2000 µmol/m²/s and found net photosynthesis peaking near 1500 µmol/m²/s at 25–30 °C under ambient CO₂, then declining above it. Repeating the measurement with CO₂ raised to 700 ppm lifted photosynthesis at a fixed 700 µmol/m²/s by roughly 44%, which is the mechanism behind the enriched-room ceiling later in this guide. Read that 1500 as a single-leaf number in an ambient room: a whole canopy under enrichment behaves differently.
Rodriguez-Morrison, Llewellyn & Zheng (2021, University of Guelph) ran a 12-week flowering cycle across a canopy PPFD gradient from 120 to 1800 µmol/m²/s in a controlled indoor room. Dry inflorescence yield rose close to linearly with light at the canopy scale, while leaf-level photosynthesis saturated well below the top treatment. Cannabinoid concentration showed no significant response to light level, so total THC per plant rose with flower mass rather than potency: more light means more grams of flower at a similar percentage, not a stronger batch. The practical lesson is scale, and it is where most spec sheets go wrong: a single leaf saturates early, but a whole canopy keeps converting photons into mass when CO₂, VPD, nutrition and irrigation are held in the ideal range. Treat 1500 µmol/m²/s as the practical ceiling for a commercial room and the trial’s higher treatments as laboratory evidence, not a setpoint.
Sources: Chandra, Lata, Khan & Elsohly, Physiology and Molecular Biology of Plants 2008, 14:299-306 (light and temperature optima) and 2011, 17:291-295 (elevated CO₂); Rodriguez-Morrison et al., Frontiers in Plant Science 2021, 12:646020. Read both before signing a spec sheet that promises more than these curves support.
Between the laboratory and your room sit three commercial realities the tables fold in: clones and seedlings waste intensity (and electricity) at high PPFD because their leaf area is tiny; flower sites harden differently at 700 versus 1100; and everything above roughly 1200 under ambient CO₂ converts to heat and kWh faster than it converts to flower.
Why Stage Matters More Than a Single Number
A room that runs one PPFD setpoint from the day cuttings root until harvest is paying for photons young plants cannot use, then starving peak flower of the headroom those weeks deserve. Dimming capability turns one fixture into four stages:
- Propagation: dim to 100–200 µmol/m²/s. Rooting tissue has no demand for more, and high light desiccates unrooted cuttings.
- Veg: 400–600 with an 18-hour day builds structure. Because the photoperiod is long, the DLI stays comparable to flower even at lower intensity.
- Early flower (weeks 1–3): ramp from roughly 700 to 900. Canopy is still open; full output lands on aisles and floor.
- Peak flower (weeks 4–7): 900–1200 at ambient CO₂, or up to 1500 where CO₂ enrichment and HVAC capacity are confirmed. This is where the fixture count is earned.
The Flip Problem: Why DLI Crashes at 12/12
The most expensive yield loss in a flowering room is not a fixture problem, it is a calendar problem. A veg room at 500 µmol/m²/s on an 18-hour day is delivering 32.4 mol/m²/day. Flip the same room to 12/12 without touching the dimmer and the daily integral falls to 21.6 overnight, a third of the light gone on the day the plants start building flower. The plants do not ramp down with it: they stretch, the canopy opens up, and the first three weeks quietly set a ceiling on everything that follows.
The fix is to replace the lost ration at the flip, then climb in steps rather than one jump:
| Phase | Photoperiod | Canopy PPFD | DLI delivered |
|---|---|---|---|
| Late veg | 18 h | 500 | 32.4 |
| Flip week, dimmer untouched | 12 h | 500 | 21.6 |
| Flip week, compensated | 12 h | 700 | 30.2 |
| Flower week 2 | 12 h | 850 | 36.7 |
| Flower weeks 3–4 | 12 h | 1000 | 43.2 |
| Peak flower weeks 5–7 | 12 h | 1100–1200 | 47.5–51.8 |
DLI: The Number That Actually Sizes Your Lighting
When a grower asks "how many fixtures do I need", the honest chain is: target DLI at peak flower → target PPFD → canopy area → fixture output and spacing. Commercial flower production is budgeted at 30–45 mol/m²/day under ambient CO₂, rising to 40–65 where the room is enriched to 900–1200 ppm, and the conversion from the table above is worth internalizing:
| Fixture-level PPFD at canopy | 12 h flower DLI | What it means commercially |
|---|---|---|
| 800 µmol/m²/s | 34.5 | Low end of the flower band; common in older retrofit rooms |
| 1000 µmol/m²/s | 43.2 | Workhorse setpoint for ambient-CO₂ rooms |
| 1200 µmol/m²/s | 51.8 | Upper edge without CO₂; only in rooms with tight climate control |
| 1500 µmol/m²/s | 64.8 | CO₂-enriched rooms only; verify HVAC before committing |
Two details trip up first-time specifiers. First, a fixture rated for a 4×4 ft footprint at 1200 µmol/m²/s achieves that number only at its stated mounting height; lower the fixture or shrink the footprint and the number changes, which is why the map matters more than the brochure. Second, DLI is an average: half the canopy above 1100 and half below 700 can average out to a healthy 43 while delivering inconsistent flower from wall to wall.
Know where the two bands meet: a 30–45 mol/m²/day ambient budget on 12 hours works out to roughly 700–1050 µmol/m²/s, so the top of the peak-flower PPFD band (1050–1200) is only reachable in a room that is either running CO₂ or genuinely at the top of its ambient capability. Past that point the photons are cheaper to vent than to convert.
Dim It or Raise It?
When a room needs less light there are two ways to get there, and they are not interchangeable. Dimming cuts output and leaves the distribution exactly as it was measured. Raising the fixtures spreads the same photons over a wider area on a longer throw, which changes the distribution you paid for.
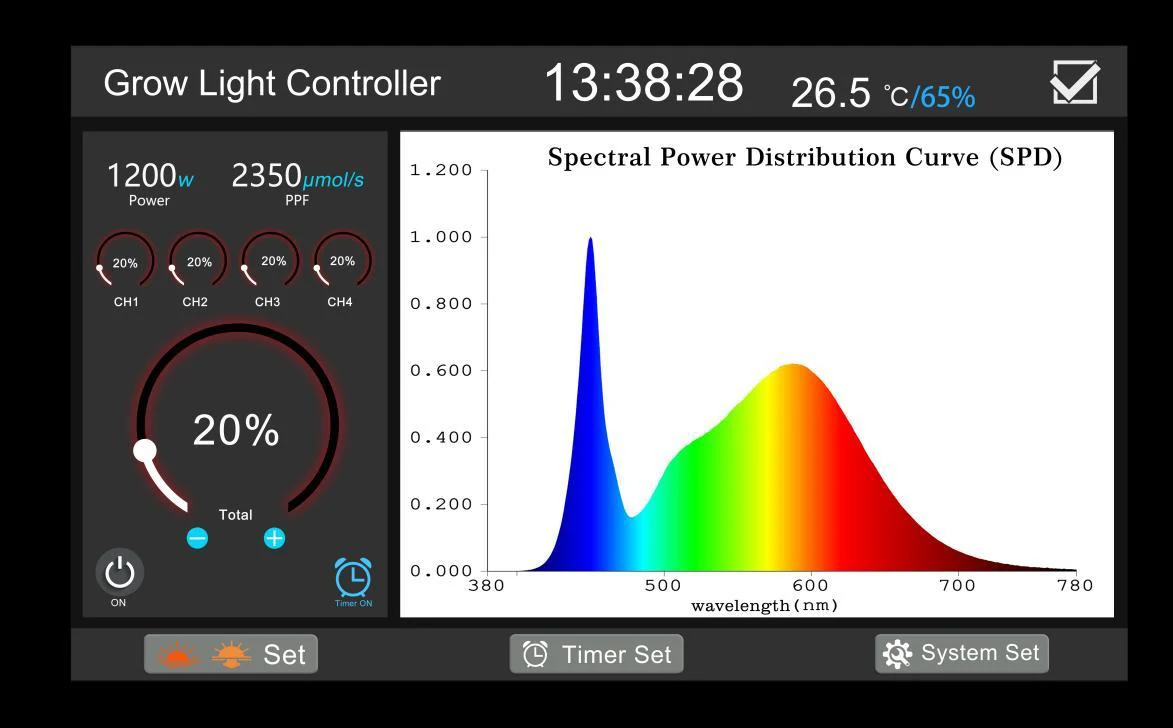
- Dim when you want the same footprint at lower intensity. That is every stage change in a fixed room: propagation, veg, early flower. A 0–10V dimmer walks the fixtures down with no change to the map, and the power draw falls with the output.
- Raise only when you are deliberately trying to cover more floor, and then re-measure. Height buys edge spill and drop-off between fixtures, and it costs you the even canopy the map promised.
There is a physics trap here too. The inverse-square law describes a point source: double your distance from a bare HPS bulb and you quarter the intensity. Modern bar and board fixtures are deliberately not point sources. They approximate an extended, overlapping plane of emitters, so doubling the mounting height does not quarter the light, it flattens and widens it, and the centre of the footprint loses more than the edges. Growers who carry the old HPS habit of dimming by raising into an LED room end up with a weak middle and light on the walls. Use the dimmer and keep the map valid.
CO₂ Changes the Math, Not the Physics
The reason CO₂ enrichment raises the useful PPFD ceiling is mechanical, not marketing: at high intensity, CO₂ availability becomes the limiting input for photosynthesis, and enriching the air to 900–1200 ppm lets the plant keep processing photons it would otherwise waste. Two operating rules follow:
- Ambient CO₂ (~420 ppm): the productive range runs 900–1200 µmol/m²/s and tops out there. Beyond that, expect diminishing returns per kWh, and leaf-level data flattens earlier still.
- Enriched (900–1200 ppm): with supplemental CO₂ the practical ceiling moves to about 1500 µmol/m²/s, and the season budget to 40–65 mol/m²/day. The Guelph trial pushed its top treatments above that in a sealed room and yield still climbed, but light-use efficiency fell as intensity rose, so each extra photon bought less flower. 1500 is the ceiling we spec, and it is only worth spending on once the CO₂ supply and the HVAC tonnage to remove the extra heat are engineered.
How to Read a PPFD Map Before You Buy
Any manufacturer can quote an average. The map tells you whether the room actually delivers it. What to demand and what to look for:
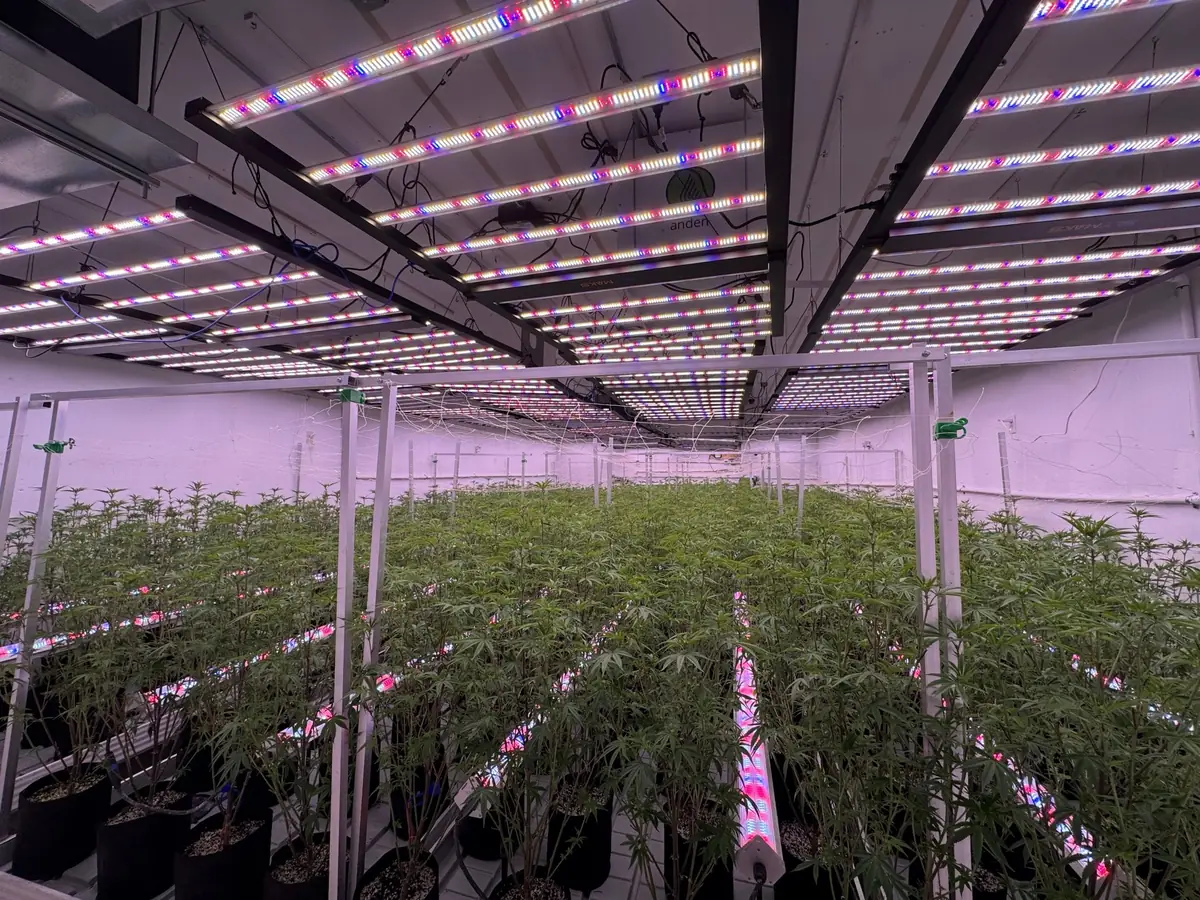
- State the conditions: mounting height, footprint, and dimming level for every reading. A map without a stated height is decoration.
- Look at the minimum, not the average: a room averaging 1000 with corners below 700 has dead zones that produce the lower grade mix. Compare the average-to-minimum ratio across candidate layouts; tighter is better.
- Check the overlap region: the space between fixtures is where cheap layouts fail. Midpoint readings should be close to the readings directly under each fixture.
- Ask for the map against your room, not a demo room: send your actual dimensions and mounting height, and a serious supplier returns a map of your geometry.
The 9-point grid, and what counts as uniform
Ask for nine readings per fixture footprint, not one: the centre, the four mid-points between fixtures and walls, and the four corners. Then divide the lowest reading by the average and read the ratio:
| min ÷ average | What it means in a commercial room |
|---|---|
| Below 0.70 | Not usable as specified; the low corners grade out as a second class of flower |
| 0.70–0.85 | Acceptable for most commercial rooms, and typical of a well-spaced layout |
| 0.85 and above | Excellent; expect a uniform canopy and consistent batch grading end to end |
Common Mistakes We See
- Chasing the headline number: buying for 1500 µmol/m²/s without CO₂ enrichment and HVAC headroom. The extra photons leave as heat.
- One setpoint for the whole cycle: running peak-flower output on rooted cuttings wastes electricity and stresses young tissue; the fix is a dimming schedule, not a different fixture.
- Reading only the average: uniformity failures hide inside healthy averages, and they surface later as inconsistent flower between the walls and the middle aisle.
- Forgetting DLI in veg: an 18-hour day at modest intensity accumulates a larger daily integral than a 12-hour day at higher intensity, which is exactly why veg rooms work at 400–600.
- Treating dimming as optional: fixed-output fixtures force compromises in at least two of the four stages. Spec 0–10V dimming from the start.
- Flipping to 12/12 with the dimmer untouched: DLI falls by a third on the day flowering starts. Raise the setpoint at the flip, then ramp weekly.
- Dimming by raising the fixtures: a bar or board fixture is not a bare bulb, so height spreads the light instead of scaling it down. You lose the centre and light the walls. Dim, and keep the map valid.
FAQ
What PPFD do I need for flowering cannabis?
Most commercial flower rooms target 900–1200 µmol/m²/s at the canopy under ambient CO₂. With CO₂ enrichment above 900 ppm, the practical ceiling moves to about 1500 µmol/m²/s. Below 700 µmol/m²/s, flower sites get thinner and bud density drops.
What is a good DLI for flowering cannabis?
Flowering rooms are budgeted at 30–45 mol/m²/day under ambient CO₂, and 40–65 mol/m²/day where CO₂ is enriched to 900–1200 ppm. A 12-hour flower day at 1000 µmol/m²/s delivers 43.2; at 1200 it delivers 51.8, which is the top edge of what an ambient room can convert. Facilities below 30 mol/m²/day usually leave yield on the table.
Is more PPFD always better?
No, and the confusion comes from mixing two scales. Leaf-level photosynthesis in cannabis peaks near 1500 µmol/m²/s under ambient CO₂, which is a single-leaf ceiling rather than a room target; at the canopy, a tightly controlled room with supplemental CO₂ keeps gaining yield past the 1500 µmol/m²/s we spec, while light-use efficiency falls. What actually sets the ceiling is CO₂, temperature, VPD and irrigation. Photons the environment cannot process leave as heat and kilowatt-hours.
What PPFD do seedlings and clones need?
Seedlings do well at 200–300 µmol/m²/s on an 18–24 hour photoperiod. Fresh clones root best at 100–200 µmol/m²/s until roots form, then step up toward 300–400 for vegetative growth.
What happens if PPFD is too high?
The classic symptoms are upward leaf curl, bleached or yellowing leaf edges near the fixture, and bud tips losing color. Under insufficiency you see stretchy plants and airy flower; under excess you see damaged tissue and wasted kilowatt-hours. Both ends cost money.
How do I convert PPFD to DLI?
Multiply PPFD by the photoperiod in hours and by 0.0036. Example: 1000 µmol/m²/s across a 12-hour flower day equals 43.2 mol/m²/day. The same fixture on an 18-hour veg schedule delivers 64.8 mol/m²/day, which is why veg rooms usually dim.
Should I dim the lights in late flower?
It is a legitimate commercial practice, not a myth: many operators ramp from 700–800 µmol/m²/s in weeks 1–3 up to full output at peak flower, and some dim 10–20% in the final week for cultivar-specific quality reasons. Results vary by cultivar, so treat it as a trial with a control group.
How uniform should a PPFD map be?
Look at the minimum reading, not just the average. Ask for a 9-point grid per footprint, divide the lowest reading by the average, and read the ratio: below 0.70 is not usable as specified, 0.70–0.85 is acceptable for most commercial rooms, and 0.85 and above is excellent. A room averaging 1000 µmol/m²/s with corners below 700 has dead zones that grade out as a second class of flower.
Why did yield drop after I flipped to 12/12?
Usually DLI rather than genetics. A room at 500 µmol/m²/s on 18 hours delivers 32.4 mol/m²/day; the same dimmer setting on 12 hours delivers 21.6. Raise the setpoint to about 700 at the flip, then climb in 10–15% weekly steps so the daily ration recovers without shocking the canopy.